INTRODUCTION
Two mid-sized biotech companies with multiple commercial products, Band-Aid Bio and Forward Biotech, have similar issues with their master data knowledge management. Each takes a different approach to addressing these issues.
Case 1
Some licensed parameters require calculation to be utilized in the manufacturing control of a process. For example, the license has media component concentrations, but in manufacturing, the mass of the component and the volume of the solution prepared are used. While producing this product, changes were made to improve the output. However, changes were only made to one of the parameters that make up a calculated parameter, pushing the parameter outside the licensed range. After the regulatory agency found the parameter outside of the licensed range, they required the company to show that all other manufacturing parameters were still within the license.
Band-Aid Bio
The technical support group at Band-Aid Bio started by manually pulling all of the parameters from the license and putting them into a table in a Word document. They then made their way through all the manufacturing controls to capture the parameter ranges for all the licensed parameters. These values were added to the table. Because the information was pulled manually, a second individual had to verify that all the values in the table were transcribed correctly. The manufacturing values were compared to the licensed ranges to confirm if they were in range. In the end, the Word document was signed by the data collectors as well as Quality to capture the activity. While this response was acceptable to the regulatory agency, they also required that it be performed annually to ensure that the parameters maintain their state of compliance.
Forward Biotech
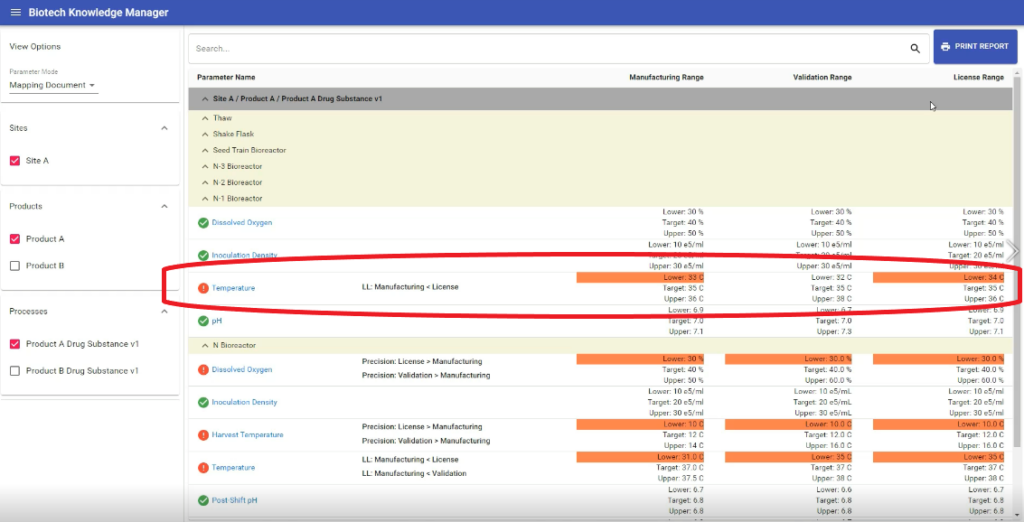
The technical support group at Forward Biotech realized that mapping the licensed parameters against the manufacturing controls would be a long-term need. Therefore, they contacted Wonderboom Software Inc. to help implement a more sustainable solution, the Biotech Knowledge Manager. Using Neo4j graph database technology, the licensed parameters were captured. (This capture was performed manually to start. As the licences don’t change often, this should be sufficient. Later, natural language processing can be used to pull the parameters out from the license documents to create a real-time verification.) The database was also connected to the manufacturing control system, where the parameters were stored. Based on the relationships created between the parameter types, the license and manufacturing controls (as well as validation) can be automatically mapped and any inconsistencies noted.

Case 2
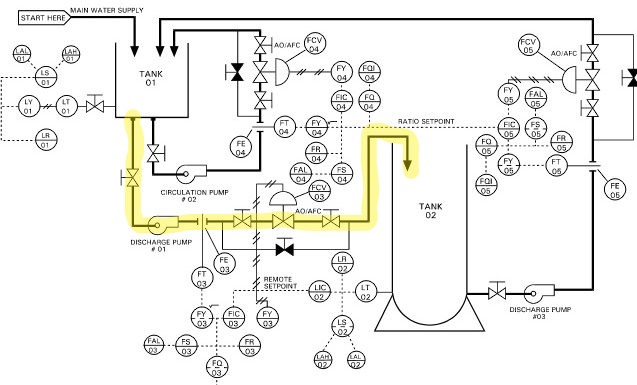
An issue occurs in manufacturing where the pipe between two tanks is impacted. As part of the resolution, the surface area of this pipe is required.
Band-Aid Bio
At Band-Aid Bio, the engineering piping and instrumentation diagrams (P&IDs) are paper-based and are located in a central document room. The engineer assigned this assessment has to go to the document room and pull all the necessary documents to determine the length and size of the pipes that connect the two tanks. They then need to use these values to manually calculate the inside surface area of all these pipes.

Forward Biotech
At Forward Biotech, they realized that having information only in paper drawings was not that helpful in the long run. All the information that was contained in the drawings was transferred into a graph database. Each type of equipment (piping, vessel, valve, pump) became a “node” of information and the “relationships” showed the way the equipment connected. Each section of piping had properties that captured the physical measurements of that pipe. Code was then created to be able to calculate the surface area between Tank 01 and Tank 02. Using this methodology, other sections of pipe could also be calculated automatically when needed in the future.


